Message the data team…
Answers take days.
You ask a simple question and wait three days for a spreadsheet from someone on the data team.
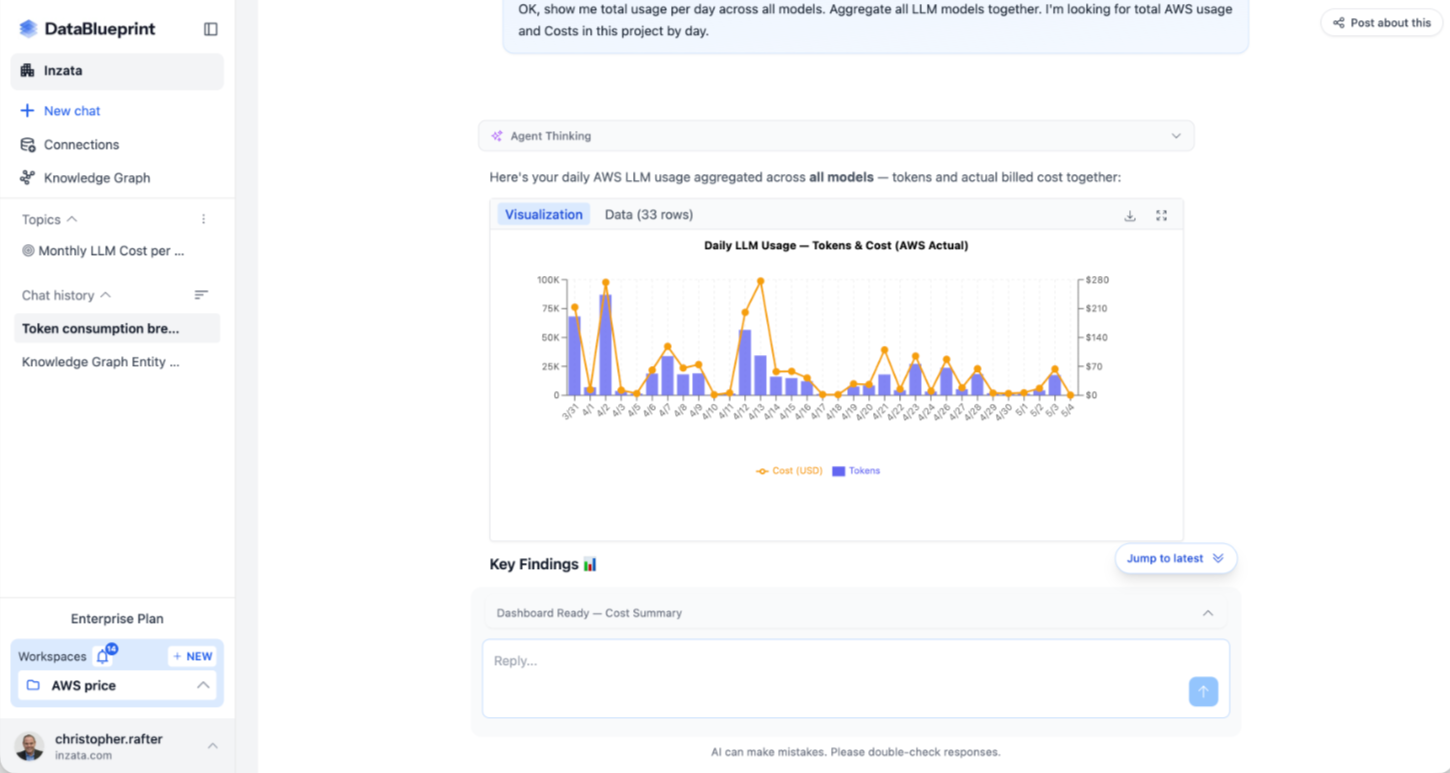
DataBlueprint connects your systems, learns how you actually operate, and answers any business question in plain English, traced to the source. No data team. Live in 15 minutes.
"We have Salesforce, HubSpot, NetSuite, and a data warehouse. Asked our CFO why margin dropped last quarter.
It took 3 analysts, 4 days, and a spreadsheet nobody fully trusted."
You ask a simple question and wait three days for a spreadsheet from someone on the data team.
CRM, ERP, BI, and spreadsheets all report the same metric. None of the numbers match.
Real visibility shouldn't cost $80K and six months of a data engineering project.
Three steps. Connected in minutes. No consultants, no data engineers, no project plan.
Plugs into your ERP, CRM, finance, HR, and ops systems. Live in minutes.
A live map of every entity and relationship across your data. You don't configure it.
Every answer cites the exact system, table, and rows it came from.
Real teams. Real decisions. Real data.
"It wasn't real until Revenue tied out. Now it's game on."
"It's critical for me to trust the AI model. Not just directionally correct."
"As a business owner, I love the fact that the data was here. It was on my servers, under my control. We don't want open AI - we don't educate the world on our intellectual property."
"To be able to go back in and look at your logic path to get to those decisions was awesome - because you don't get that in other AI. That really helped us from an auditing point of view."
"The ability to incorporate QuickBooks was awesome. It went through and evaluated all of our customers' current open balances. It was fantastic."
14 days to start. Free workspace to keep. No credit card, ever.
Free workspace keeps your connectors live
No credit card. No auto-charge. Ever.
Upgrade only when DataBlueprint earns it


Not a demo. Not sample data. Connect your systems and get real answers from your actual data.
Direct Mail spend +15% with near-zero conversion
$238K wasted
Every result cites the exact system, table, and row it came from. Nothing is generated. Everything is traced.
Connect your first system in 15 minutes. No consultants, no project plan, no PO required.